
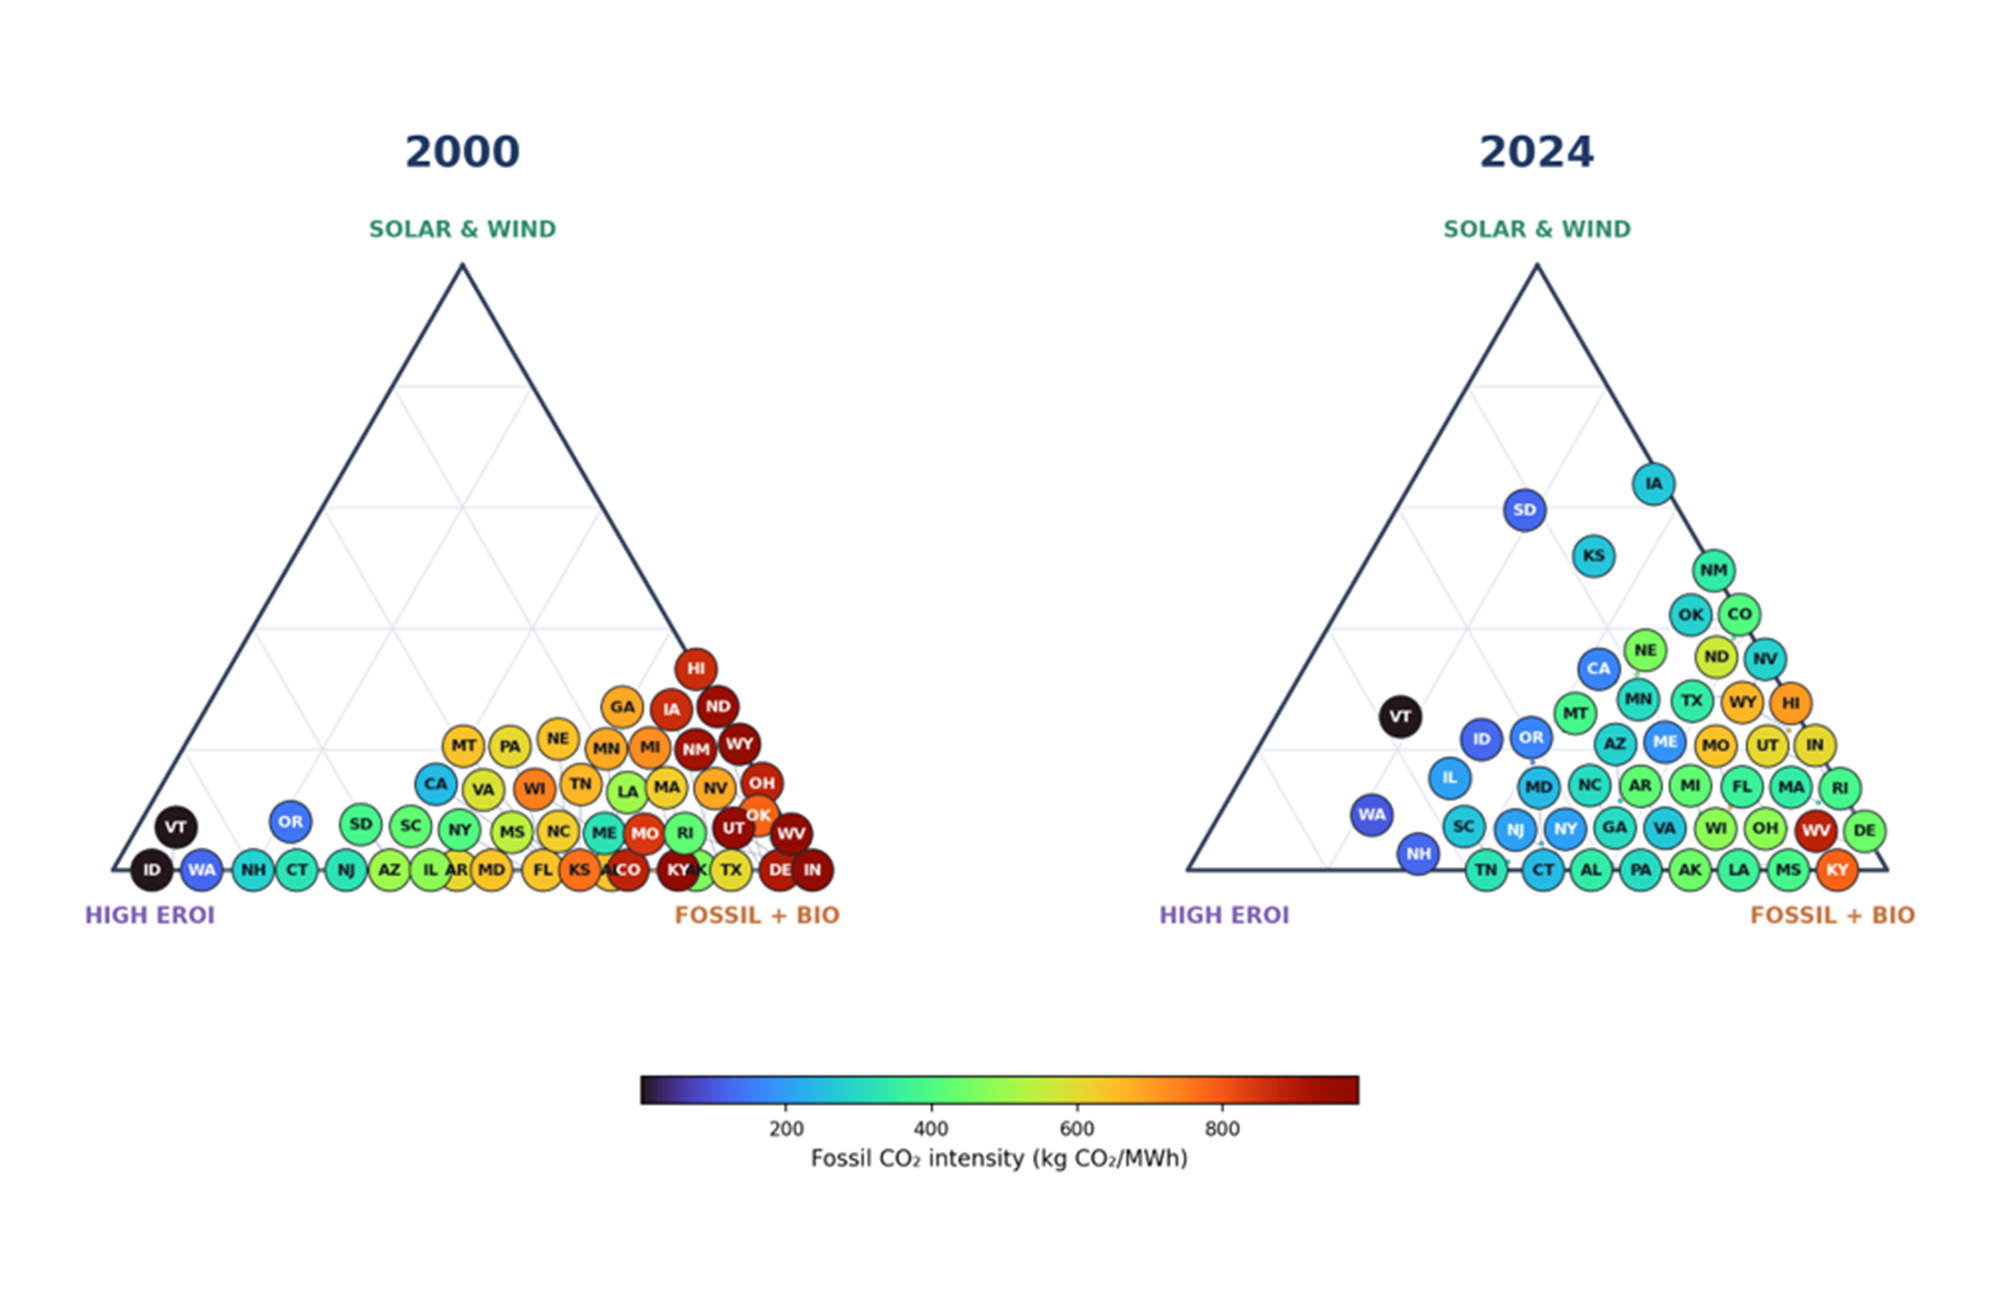
Carbon intensity trinary diagrams: many states have substantially decreased CO2 emissions from the generation of electricity.
Has the build-out of solar and wind power systems caused high electricity prices?
Does clean energy cause high electricity prices? The short answer is no. Solar and wind have come down in price to the point where they are economically competitive with fossil energy power systems.
However, wind and solar are intermittent, and energy storage is still expensive. In this month’s article, we’ll discuss the overall effects of the solar and wind build-out so far. We’ll also discuss the effects of the other major change that has enabled the U.S. to reduce CO2 emissions from electrical power generation — a transition from coal to natural gas as the chief source of electrical power.
This month, as with last month, we primarily discuss electrical power. However, we want to keep our sights on the target: getting control of the greenhouse gas content of the Earth’s atmosphere.
Accordingly, here is a quick review of what we discussed in the first three parts of this series:
1. Continued good news about CO2 emissions and removals
Global human emissions of carbon dioxide (anthropogenic CO2), which increased exponentially during the last part of the 20th century, have mostly flattened since about the year 2012. This was enabled largely by the development of fracking technology, which made carbon-lean natural gas much more available, and dropped its price.
It was also aided by advances in solar and wind technology, supported by government and industry investments, so that mass-produced wind power generators and solar photovoltaics now produce electricity at prices that are competitive with fossil energy.
In addition, scientific investigations of the planet’s carbon balance show that the Earth’s natural carbon sinks continue to remove CO2 from the atmosphere at rates that are directly proportional to the concentration of CO2 in the atmosphere. That’s good news, because removals by natural sinks limit the accumulation of CO2 in the atmosphere.
2. With continued efforts to reduce anthropogenic CO2 emissions, lower atmospheric CO2 targets are obtainable
Atmospheric levels of CO2 are now about 430 ppm (parts per million), about 60% greater than they were 250 years ago. As a result, the greenhouse gas effect of atmospheric CO2 (and a few other greenhouse gases) has caused the global average surface temperature to increase by about 1.3 – 1.4°C (degrees centigrade), 2.3 – 2.5 degrees fahrenheit, since pre-industrial times. We are almost certainly going to exceed the provisional goal of no more than 1.5°C rise; but the more realistic goal of no more than 2.0°C rise is, in our view, still achievable. In fact, a long-term warming of only 1.0°C may be attainable.
However, doing this will require continued, aggressive efforts to replace high-carbon energy infrastructure with low-carbon, carbon-free, and negative-carbon energy infrastructure.
By stabilizing (and then reducing) anthropogenic CO2 emissions, this generation can gain control of the greenhouse gas content of the atmosphere
Economic gravity always wins. The key is to continue developing and deploying low-carbon, carbon-free and negative-carbon energy technologies that are economically-preferable to fossil energy technologies.
The data convinces us that humans can economically bring the greenhouse content of the atmosphere under control by mid-century
Our suggested targets, proposed in the third article of this series, are:
- A near-term goal of reducing atmospheric levels to 400 ppm CO2 — reduce anthropogenic emissions, achieving peak CO2 atmospheric levels within two to three decades and reduced atmospheric CO2 at about 400 ppm by the end of this century, and
- A more aggressive, provisional goal of further reducing atmospheric levels to 350 ppm CO2 — better yet, let’s try to get down to 350 ppm CO2 by the end of this century or early in the 22nd century.
To do this, we need to aggressively bring forward advanced, clean energy technologies that are economically-competitive with — and then economically preferable to — existing fossil carbon energy systems.
Positive feedback loops: affordable solar and wind power systems were enabled through a cooperative combination of technology development, engineering for hardware mass production, and government policies.
This is also the paradigm for continuing to bring in new, advanced energy technologies, like hydrogen and fuel cells, so that they compete economically in the marketplace, accelerating further reductions in greenhouse gas emissions.
Now, let’s return to discussing the topic of Part 4 of this series: the electrical grid, which is leading the way (with transportation close behind)!
50 states = 50 experiments!
Each U.S. state has its own governance over electrical power, as well as unique combinations of other aspects, such as population density, industries, and available energy resources. This means that, over the last 25 years, we’ve had 50 experiments underway to affordably reduce CO2 emissions.
What do these experiments tell us about how alternative energy power systems are faring in the U.S, especially regarding the oft-repeated comment that wind and solar power are expensive?
As we’ll show below, although wind and solar were prohibitively expensive at the start of this century — there was practically no wind or solar electricity on the nation’s electrical grids that year — the cost has come down substantially.
In fact, solar and wind provided nearly 20% of the U.S.’ electricity in 2025! This is a massive triumph that was made possible by continued technology development, figuring out hardware mass production, and strategic government policies (like subsidies) that encouraged adoption of solar and wind power systems. Done well, these three areas form cooperative feedback loops that accelerate solar and wind deployments in ways that can be used to identify the best approaches for later years. We’re going to ‘data mine' these 50 experiments to learn how additional advanced energy technologies, like hydrogen and fuel cells, can be made part of the future energy mix — in the U.S. and globally.
It’s important to note that the 50 states don’t exactly define 50 independent experiments. There is ample communication amongst utility managers and regulators, so that results in one set of states help inform decisions in other states. This tends to normalize things like electrical production costs.
Since the start of the 21st century, U.S. states have collectively reduced CO2 emissions from the generation of electricity by about 33%. Just as saving a small amount of money each year eventually leads to substantial savings, reducing emissions by an average of a little over 1% per year is already paying off big time. Europe is also reducing CO2 emissions each year and, as previously stated, global CO2 emissions have almost stopped growing.
But to what extent have the states succeeded in reducing CO2 emissions? And what are the additions of solar and wind, as well as transitions from coal to natural gas, actually costing us? How has a rapid transition from essentially 0% solar and wind to nearly 20% affected emissions and electricity prices?
For this month’s review, we’re using trinary diagrams again, but we’re shifting the vertices in the diagrams from being about base-load electrical generation, load-following electrical generation, and variable renewable electrical generation to something that more readily addresses that question about the economic penalties (or gains) from solar, wind, and natural gas.
This month the categories are:
High energy return on energy invested (high EROEI), which represents generation systems that produce, over their lifetimes, the greatest ratio of electrical energy to the energy used in manufacturing and building them. In the Mid-Columbia region, this is nuclear and hydro power.
Fossil and bio, which are power generators that use fossil fuels and bio-derived fuels, including the big three fossil fuels: coal, natural gas, and oil. It also includes biomass-derived fuels, including renewable natural gas (such as methane from anaerobic digesters, landfills, and agricultural sources).
Solar and wind, placed on a vertical axis (the top vertex in the trinary diagrams), allows us to single out the price and carbon-intensity impacts of increasing the proportion of solar and wind electricity generated in each state.
One thing that we love about these diagrams is that it makes it easy for everyone to see trends (or the absence of trends) for themselves.
The human eye and brain are very effective at spotting patterns (including correlations that aren’t really there!); so, we have mapped each state in its approximate position in the trinary, according to its percentages of power generation by high EROEI units, fossil and bio units, and solar and wind units.
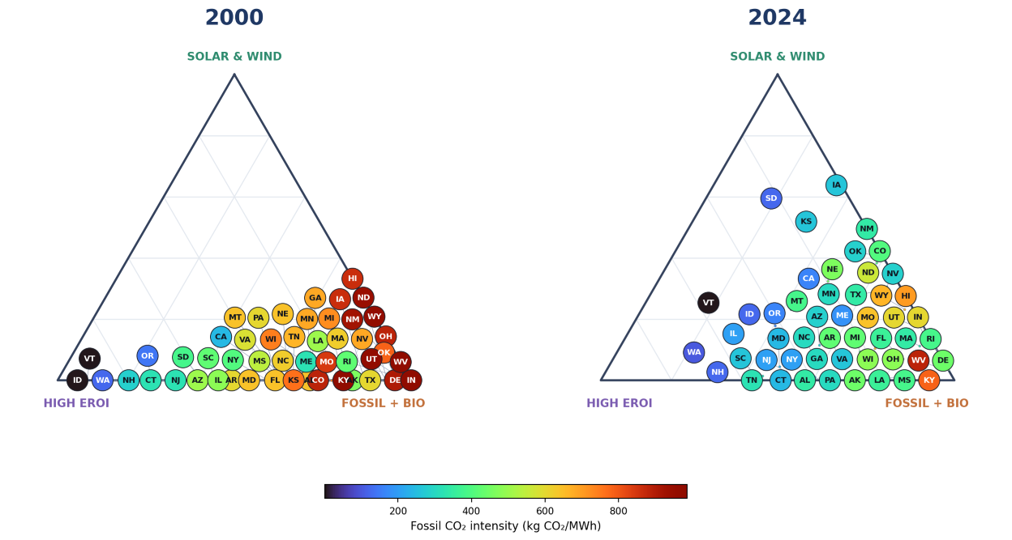
Carbon intensity trinary diagrams: many states have substantially decreased CO2 emissions from the generation of electricity.
As previously mentioned, the USA’s electrical sector has decreased CO2 emissions by about 33% over the time period. However, these decreases are only partly due to the build-out of solar and wind. They are mostly due to shifting from high use of coal to natural gas, a change that also reduces air pollution (and the health effects of air pollution).
Note: Some artistic license has been taken to fit all the states on the diagrams. Since there was very little solar- and wind-generated electricity in 2000, the states actually all belong along the bottom of the left trinary diagram!
From the carbon-intensity trinaries: carbon intensity is falling, and the correlation is visually apparent!
Here we use color-coding to represent the carbon intensity of electricity from each state, in units of kilograms of fossil CO2 per megawatt-hour (kg CO2/MWh). This allows us to use the colors to distinguish the lowest carbon-intensity states (in blue and black), which emit the least amount of CO2 per electrical product, and the highest carbon-intensity states (in orange and red).
Looking from the left trinary (the year 2000) to the right trinary (the year 2024), the overall shift in colors is very apparent and reveals the large reductions in the carbon intensity of electric power during that period.
States have generally reduced the carbon intensity of their electricity through a combination of shifting from carbon-rich coal to carbon-lean natural gas, as well as through the introduction and build-out of carbon-free solar and wind.
Indiana, for example, with heavy use of coal-fired power plants for the year 2000, was at the bottom right of the diagram and is color-coded with high carbon intensity. However, after shifting much of its coal to natural gas and building several wind farms, Indiana is no longer at the bottom right. This shift from the bottom right toward the top by adding solar and wind is clearly related to reducing the carbon intensity of electrical power.
It is interesting to note that Washington State has one of the lowest carbon-intensity values in both years, due to its relative abundance of hydroelectric and nuclear power.
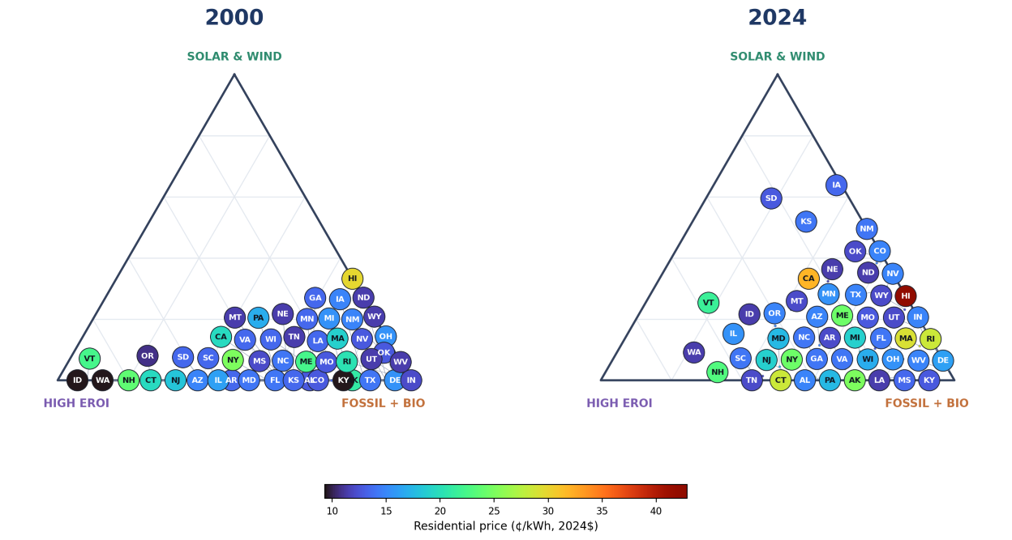
Electricity price trinary diagrams: modest correlations between the residential price of electricity and the build out of solar and wind.
These trinary diagrams group power generation sources into three categories in a way that helps us examine states that have high solar and wind penetration, which are highest on the chart. Prices for the year 2000 were inflation-adjusted to 2024 dollars.
Some points worth mentioning are:
- States most reliant on solar and wind in 2025 (Iowa, South Dakota, Kansas, New Mexico) have relatively low electricity prices.
- The states with the greatest prices – notably Hawaii and California – have high prices for reasons other than the build-out of solar and wind.
- The apparent absence of a clear, general correlation between residential electricity prices and the build-out of solar, as the color-coding implies, means that other factors have a greater influence on electricity prices. In fact, while the data has a lot of ‘scatter’, the statistical correlation between price increases and reduced CO2 emissions per MWh, from 2000 to 2024, taking into account all 50 states, is slightly negative! Factors other than the build-out of solar and wind have had greater effects on electricity prices.
- However, subsidies like the Federal Production Tax Credit undoubtedly help solar and wind have reduced impacts.
Note: Same comment on artistic license as in the previous pair of trinary diagrams. For the year 2000, all states actually belong along the bottom of the trinary diagram.
From the electricity price trinaries: a correlation of price with solar and wind isn’t readily apparent
The most striking conclusion from the pair of electricity price trinaries is their contrast to the first pair — it is difficult to see a similar relationship between building out solar and wind with higher prices.
According to conventional wisdom, states with the greatest build-outs of solar and wind experience substantial cost increases. However, we don’t see higher prices (redder colors) for states more reliant on wind and solar. In fact, some states, including the ones that most aggressively built out solar and wind, actually experienced price reductions.We consider this lack of an easily visible correlation to be good news! Other factors have greater impacts on electricity prices.
Overall, this data implies that the strategies with which we reduce CO2 emissions matter. That is, deployment strategies can have a substantial effect on the economic productivity with which we reduce carbon emissions from our energy systems.
We expect to follow up with more on this in subsequent articles. Next month: Transportation!
Climate scientist Steve Ghan leads the Tri-Cities chapter of Citizens Climate Lobby.
Bob Wegeng, an engineer who worked in the energy industry before joining the Pacific Northwest National Laboratory as a technology developer, is the co-holder of three R&D 100 awards and is now the president of a startup company in the Tri-Cities.
